Elezioni del 10 giugno 2001
RIEPILOGO GENERALE
| TOTALE SEGGI SCRUTINATI (60/60) | ||||
|---|---|---|---|---|
| % 2001 | % 1998 | Differenza | ||
| ISCRITTI | 30688 | - | - | - |
| VOTANTI | 22648 | 73,80 | 75,28 | -1,48% |
| BIANCHE/NULLE | 860 | 3,80 | 3,84 | -0,04% |
| VOTI VALIDI | 21788 | 96,20 | 96,16 | +0,04% |
![]()
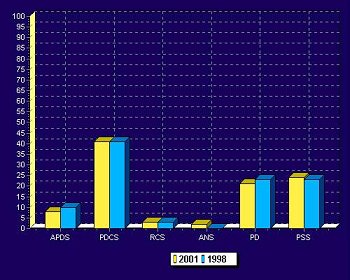
VOTI DI LISTA
| LISTE | VOTI | % 2001 | % 1998 | Differenza | SEGGI |
| APDS | 1794 | 8,23 | 9,81 | -1,58% | 5 |
| PDCS | 9031 | 41,45 | 40,85 | +0,60% | 25 |
| RCS | 738 | 3,39 | 3,27 | +0,11% | 2 |
| ANS | 421 | 1,93 | - | +1,93% | 1 |
| PD(*) | 4535 | 20,81 | 22,84 | -2,02% | 12 |
| PSS | 5296 | 24,18 | 23,23 | +0,96% | 15 |
![]()
(*) Il raffronto del risultato del 2001 del PD con quello del 1998 č stato ottenuto assommando, nella consultazione del 1998, i voti ottenuti dalle liste SR e PPDS-IM-CD che, nel frattempo, hanno dato luogo ad una fusione costituendo il PD.
![]()
![]()
GRAFICO RISULTATI GENERALI
|
|
|
![]()
![]()
- Copyright 2026 © Segreteria di Stato per gli Affari Interni
- Parva Domus - Piazza della Libertŕ 47890 - San Marino
- Tel 0549 882425 Fax 0549 885080 - from outside Italy +378 replace 0549